Calculating degrees of freedom is a fundamental concept in statistics, particularly in hypothesis testing and confidence intervals. The degree of freedom is a measure of the number of independent pieces of information used to calculate a statistic. In this article, we will delve into the world of degrees of freedom, exploring the concept, its importance, and how to calculate it in various statistical scenarios.
Understanding Degrees of Freedom

Degrees of freedom are essential in statistical analysis as they help determine the accuracy of estimates and the reliability of results. The concept is closely related to the idea of independent observations. In a dataset, if one value is determined by other values, it is not independent, and therefore, it does not contribute to the degrees of freedom. For instance, in a sample of exam scores where the mean is known, if all but one score are given, the last score can be determined by the mean and the other scores, illustrating a lack of independence.
Why Degrees of Freedom Matter
Degrees of freedom play a critical role in statistical inference, affecting the calculation of statistical tests, such as t-tests and chi-square tests. The number of degrees of freedom influences the shape of the distribution of these test statistics, which in turn affects the p-values and the conclusions drawn from the data. Incorrectly calculating degrees of freedom can lead to flawed conclusions, emphasizing the importance of understanding this concept.
Calculating Degrees of Freedom in Common Statistical Tests

The calculation of degrees of freedom varies depending on the statistical test being used. Here are some common scenarios:
T-Test
In a t-test, which compares the means of two groups, the degrees of freedom depend on the type of t-test. For a one-sample t-test, where we compare the mean of a sample to a known population mean, the degrees of freedom (df) equals the sample size minus one (df = n - 1). For an independent samples t-test, comparing the means of two groups, the degrees of freedom can be calculated using the formula df = (n1 - 1) + (n2 - 1), where n1 and n2 are the sample sizes of the two groups.
Chi-Square Test
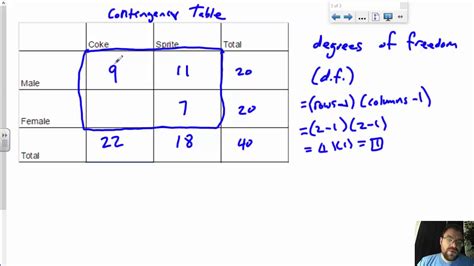
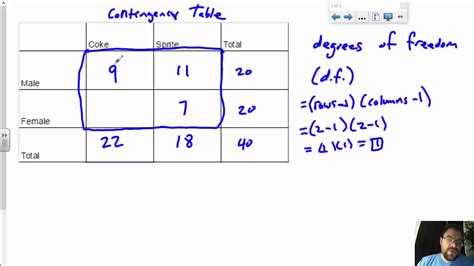
For a chi-square test of independence, which examines the relationship between two categorical variables, the degrees of freedom are calculated as (r - 1) * (c - 1), where r is the number of rows and c is the number of columns in the contingency table.
ANOVA
In Analysis of Variance (ANOVA), which compares means across three or more groups, the degrees of freedom for the between-group variation are calculated as k - 1, where k is the number of groups. The degrees of freedom for the within-group variation (or error) are calculated as N - k, where N is the total number of observations across all groups.
| Statistical Test | Degree of Freedom Formula |
|---|---|
| One-sample T-Test | df = n - 1 |
| Independent Samples T-Test | df = (n1 - 1) + (n2 - 1) |
| Chi-Square Test of Independence | df = (r - 1) * (c - 1) |
| ANOVA | Between-group df = k - 1, Within-group df = N - k |

Practical Considerations and Common Mistakes
While calculating degrees of freedom, it’s essential to avoid common mistakes such as incorrectly counting the number of independent observations or misapplying formulas. For instance, in regression analysis, the degrees of freedom for the residual sum of squares is n - p - 1, where n is the number of observations and p is the number of predictors, including the intercept. A frequent error is forgetting to subtract 1 for the intercept.
Real-World Applications
Degrees of freedom have practical applications in various fields, including quality control, where statistical process control charts are used to monitor the performance of manufacturing processes, and in medical research, where clinical trials rely on accurate statistical analysis to determine the efficacy and safety of new treatments.
Key Points
- The concept of degrees of freedom is fundamental in statistical analysis, reflecting the number of independent observations used to calculate a statistic.
- Degrees of freedom vary by statistical test, with specific formulas for t-tests, chi-square tests, ANOVA, and regression analysis.
- Accurate calculation of degrees of freedom is crucial for drawing correct conclusions from data analysis.
- Common mistakes include miscounting independent observations and misapplying formulas.
- Degrees of freedom have significant practical applications in quality control, medical research, and other fields relying on statistical inference.
In conclusion, calculating degrees of freedom is a critical aspect of statistical analysis, requiring a deep understanding of the underlying concepts and formulas specific to each statistical test. By avoiding common pitfalls and applying the correct formulas, researchers and analysts can ensure the accuracy and reliability of their findings, contributing to informed decision-making across various disciplines.
What is the purpose of calculating degrees of freedom in statistical tests?
+Calculating degrees of freedom is essential for determining the accuracy of estimates and the reliability of results in statistical tests. It affects the calculation of statistical tests and confidence intervals, influencing the conclusions drawn from the data.
How do you calculate degrees of freedom for a t-test?
+The calculation of degrees of freedom for a t-test depends on the type of t-test. For a one-sample t-test, df = n - 1, where n is the sample size. For an independent samples t-test, df = (n1 - 1) + (n2 - 1), where n1 and n2 are the sample sizes of the two groups.
What is the formula for calculating degrees of freedom in ANOVA?
+In ANOVA, the degrees of freedom for the between-group variation are k - 1, where k is the number of groups. The degrees of freedom for the within-group variation are N - k, where N is the total number of observations across all groups.
